On ne va pas regarder en détail chaque type de graphique car cela reviendrait à faire le site de Plotly. Voici une selection de graphiques qui peuvent avoir leur intérêt dans le cadre de ce cours. N'hésitez pas à aller sur le site web de Plotly si vous ne trouvez pas ce que vous cherchez ici.
Graphiques scientifiques
| Fonction | Image | Fonction | Image |
|---|---|---|---|
| quiver | 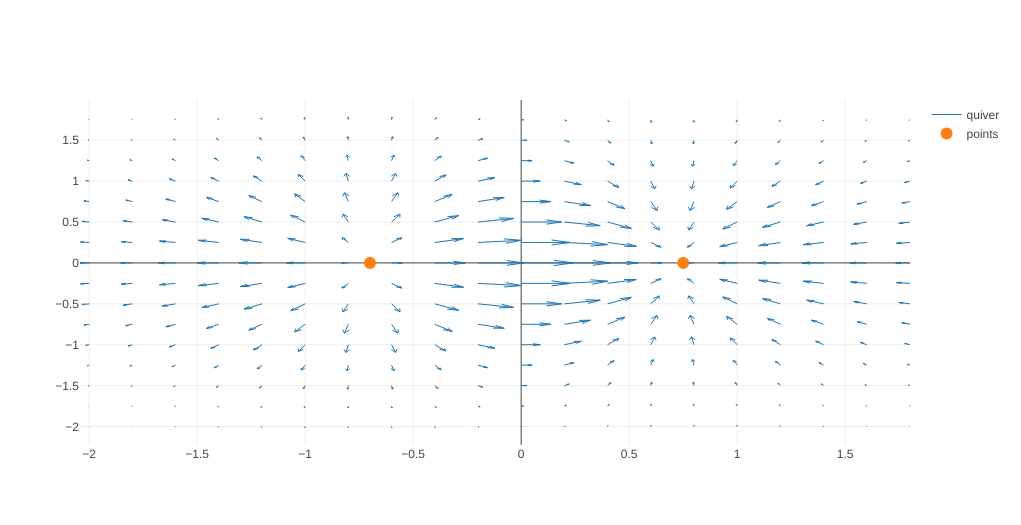 |
streamline | 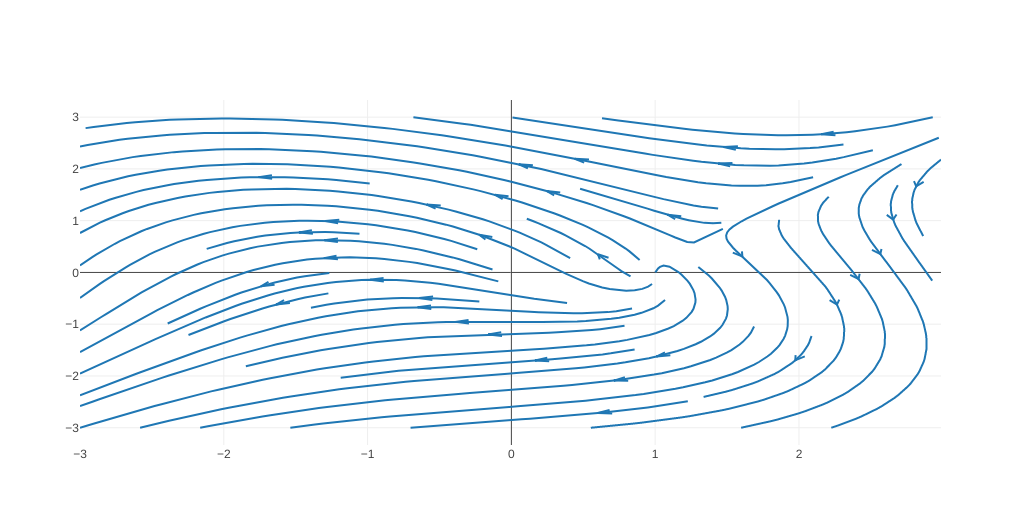 |
| contour | 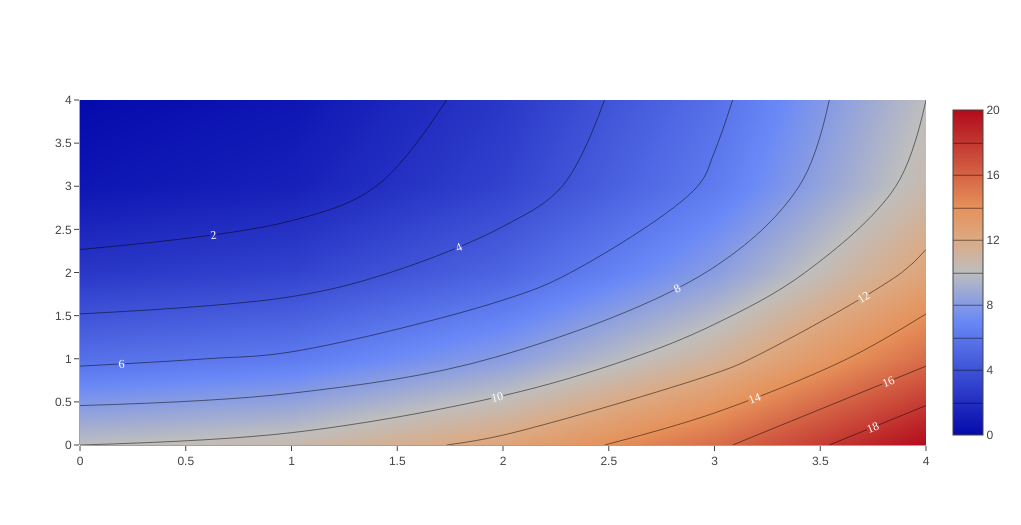 |
ternary contour | 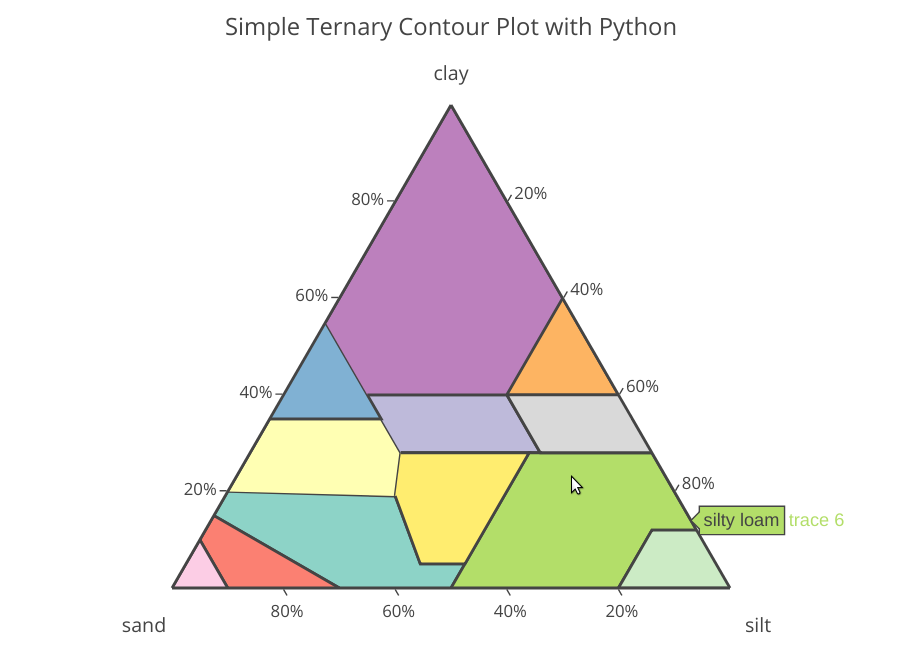 |
| Scatterpolar | 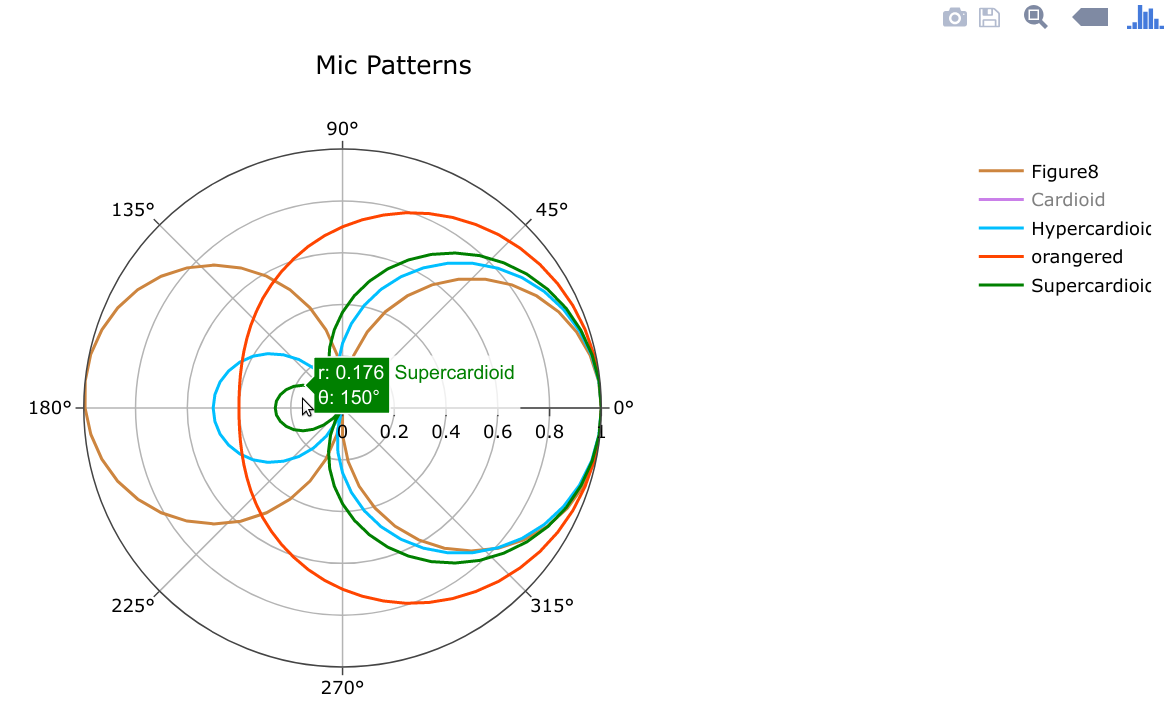 |
chord-diagram | 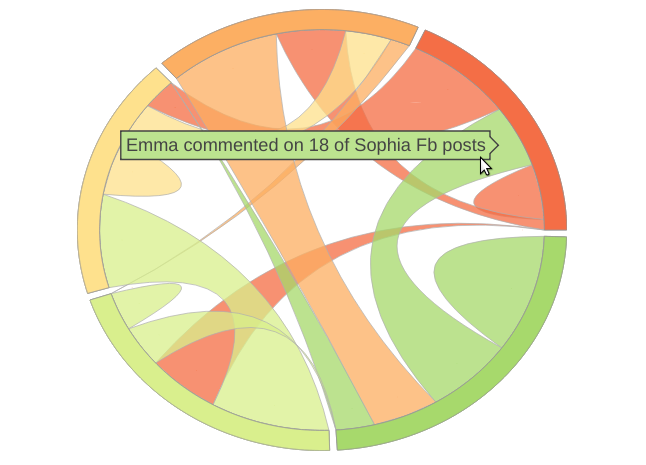 |
Pour une liste plus complète, voir https://plot.ly/python/scientific-charts/.
Graphiques statistiques
| Fonction | Image | Fonction | Image |
|---|---|---|---|
| 2D density | 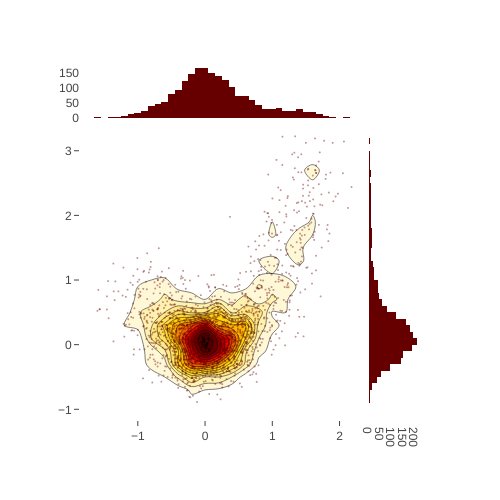 |
distplot | 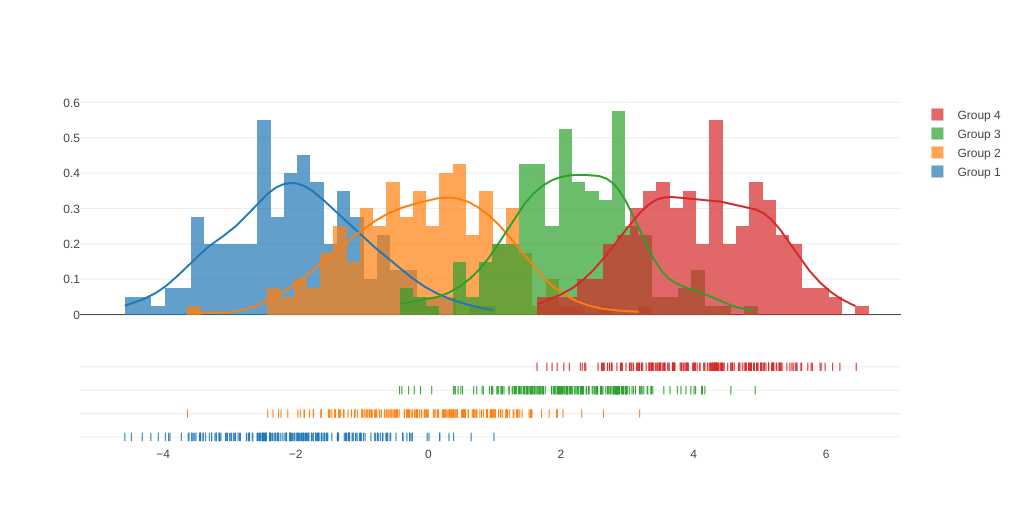 |
| heatmaps and annotated heatmaps | 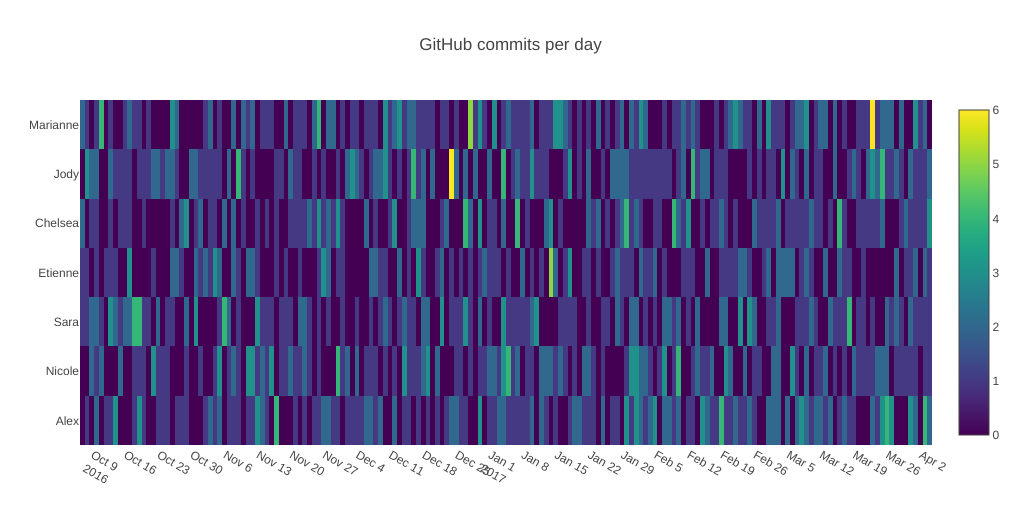 |
violin | 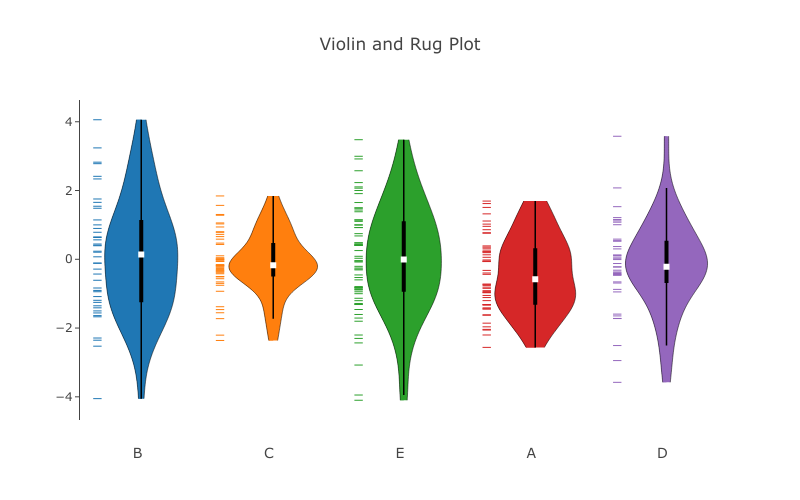 |
Graphiques financiers
| Fonction | Image | Fonction | Image |
|---|---|---|---|
| candlestick | 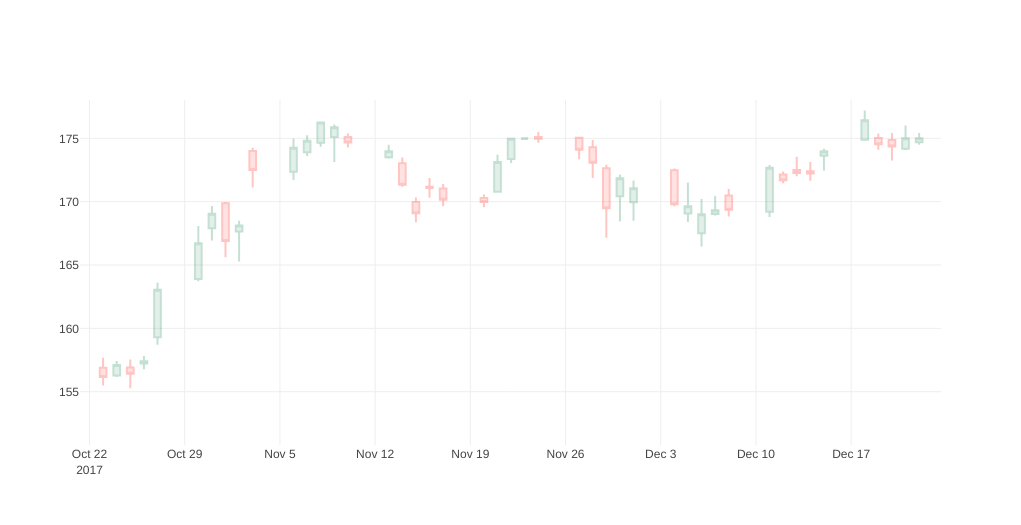 |
ohlc | 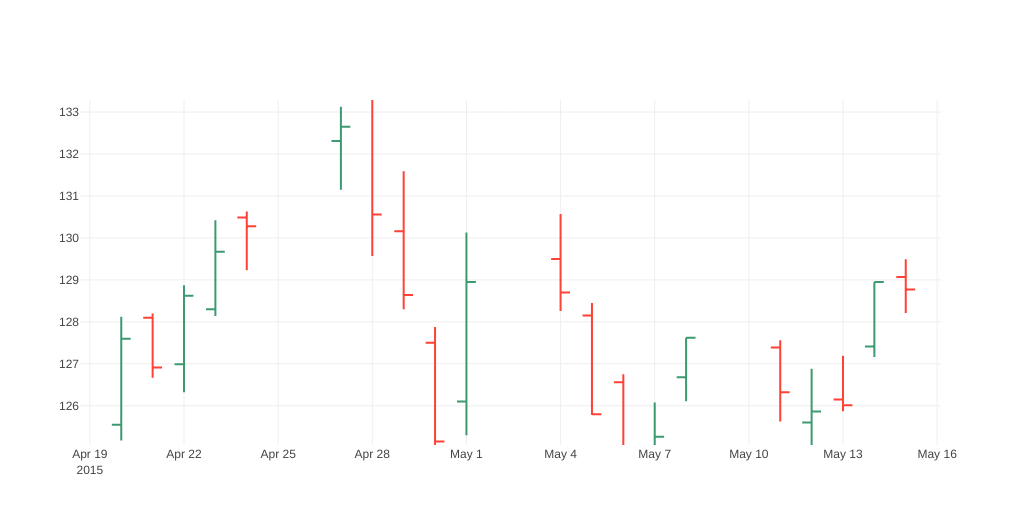 |